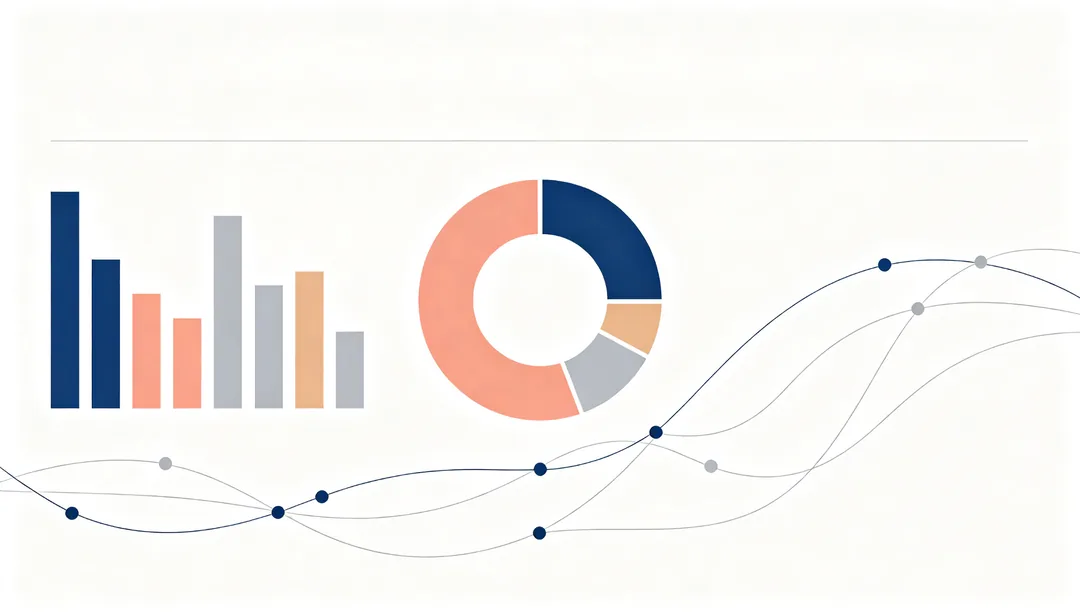
인포그래픽 데이터 · PPT 소재
이용 방법
1
Describe the topic
Write one line about the deck or the section. No image is needed.
2
Pick a deck style
Choose a look for business, tech, lessons or events, and set the ratio to 16:9.
3
Generate and place
Generate, download and drop the image into your slide as a background or visual.
PPT 소재의 다른 스타일

블루 & 화이트 클린
클래식한 코퍼레이트 블루와 넉넉한 여백으로 깔끔하고 전문적인 슬라이드 배경을 만들어요.

다크 프리미엄
짙은 차콜 배경에 가느다란 골드 라인을 더해 최상급 비즈니스 톤을 전해요.

그라데이션 모던
흐르는 모던 그라데이션에 떠 있는 기하 도형을 더해 요즘 감각의 슬라이드를 만들어요.

파이낸스 시리어스
차트가 잘 살아나는 안정적인 팔레트로 데이터 중심의 금융 이야기를 풀어내요.
컨설팅 미니멀
최상위 전략 컨설팅 자료를 닮은 구조적이고 미니멀한 레이아웃이에요.

스타트업 프레시
플랫 일러스트 도형으로 만든 생기 있고 젊은 배경이 초기 브랜드의 에너지를 살려요.

기업 연차 보고서
인포그래픽을 촘촘히 담은 격식 있는 표지로 연차 보고서와 성과 보고에 맞췄어요.

리걸 포멀
어둡고 엄숙한 배경에 세리프를 앞세워 법률·기관다운 격식을 전해요.