Infografik Daten · Präsentationsmaterial
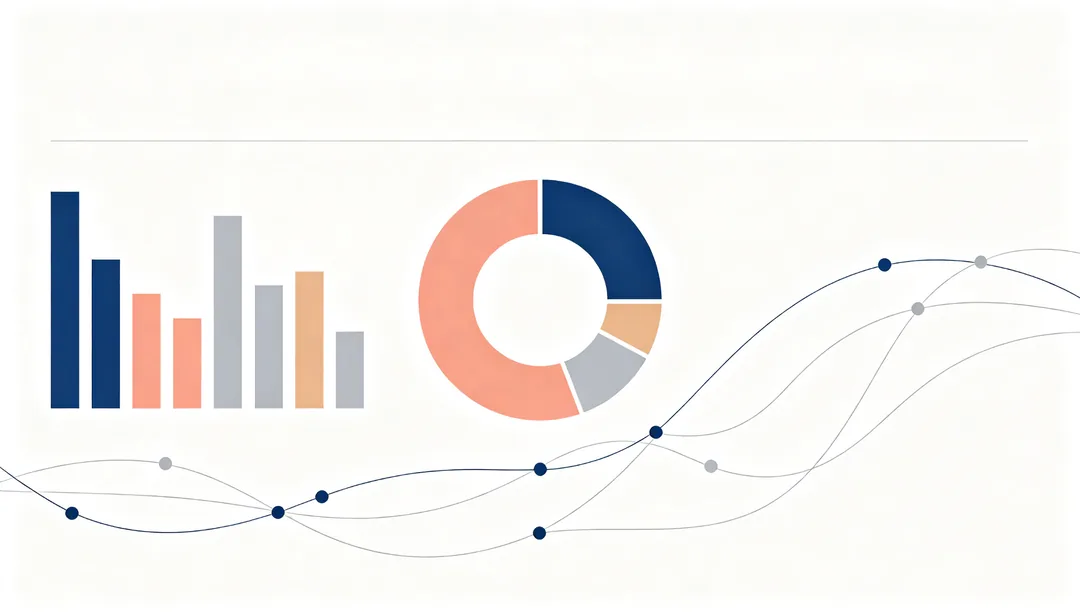
Eine dichte Anordnung abstrakter Diagramm-Icons und fließender Knotendiagramme bildet eine datenreiche Infografik-Basis.
Tags
- Infografik
- Datenvisualisierung
- Icons
- Statistik
So funktioniert es
1
Describe the topic
Write one line about the deck or the section. No image is needed.
2
Pick a deck style
Choose a look for business, tech, lessons or events, and set the ratio to 16:9.
3
Generate and place
Generate, download and drop the image into your slide as a background or visual.
Weitere Stile in Präsentationsmaterial

Blau & Weiß Clean
Klassische Corporate-Blautöne mit viel Weißraum für einen klaren, professionellen Folienhintergrund.

Dark Premium
Ein tiefer Anthrazit-Hintergrund mit feinen Goldlinien vermittelt einen exklusiven, hochwertigen Business-Ton.

Verlauf Modern
Fließende moderne Verläufe mit schwebenden geometrischen Formen für einen zeitgemäßen Folienlook.

Finanzen Seriös
Eine ruhige, diagrammfreundliche Palette für datenlastige Finanzpräsentationen.

Consulting Minimal
Ein strukturiertes, minimales Layout im Geist erstklassiger Strategieberatungs-Decks.

Startup Frisch
Ein lebendiger, jugendlicher Hintergrund aus flachen Illustrationsformen für Early-Stage-Markenenergie.

Geschäftsbericht
Ein formeller, infografiklastiger Cover-Stil für Jahres- und Meilensteinberichte.

Recht Formell
Ein dunkler, würdevoller Hintergrund, der serifenbetonte juristische und institutionelle Förmlichkeit ausstrahlt.